 Feng Ruohang
15def34dce
Feng Ruohang
15def34dce
The tree still carried a complete second publishing pipeline inherited from
upstream that pgsty has never operated, plus MinIO-branded artwork the fork has
no right to redistribute. None of it is a pgsty release artifact, so the
history-is-immutable rule does not protect it: nothing here was ever published
under this repository's name, and git history plus the pre-cutover tag keep the
provenance.

Removed, by category:

- charts.min.io machinery: CNAME (charts.min.io), _config.yml, index.yaml,
  helm-reindex.sh and 90 helm-releases/minio-*.tgz. GitHub Pages is not enabled
  on this repository, so this was dormant - but enabling Pages for any reason
  would have stood up a convincing impostor of the official MinIO chart
  repository from our own domain.

- Dockerfiles that consume upstream binaries: Dockerfile, Dockerfile.cicd,
  Dockerfile.hotfix, Dockerfile.release, Dockerfile.release.old_cpu,
  Dockerfile.scratch and docker-buildx.sh. These fetch or expect a MinIO-built
  binary; a Silo image must only ever contain an artifact this repository built
  from this commit. Dockerfile.goreleaser, the one the release workflow
  actually uses, stays.

- buildscripts/upgrade-tests/ (compose.yml, minio.env, nginx.conf), which
  pinned minio/minio images through a MINIO_VERSION compose variable. The
  upgrade test is rebuilt on image digests in a later commit.

- docs/hotfixes.md, describing an upstream hotfix distribution channel that
  does not exist for this fork.

- MinIO trademark artwork: .github/logo.svg (a recoloured MinIO wordmark), the
  docs/screenshots/ set, the Grafana dashboard screenshots and
  docs/federation/lookup/bucket-lookup.png. The dashboards themselves are kept
  and rebranded separately; only the images carrying MinIO chrome go.

Deliberately not touched: published releases, tags, image digests and package
signatures remain byte-identical. This commit only removes paths that were
never part of a pgsty release.

Co-Authored-By: Claude Opus 5 (1M context) <noreply@anthropic.com>
How to monitor MinIO server with Grafana 
Grafana allows you to query, visualize, alert on and understand your metrics no matter where they are stored. Create, explore, and share dashboards with your team and foster a data driven culture.
Prerequisites
- Prometheus and MinIO configured as explained in document here.
- Grafana installed as explained here.
MinIO Grafana Dashboard
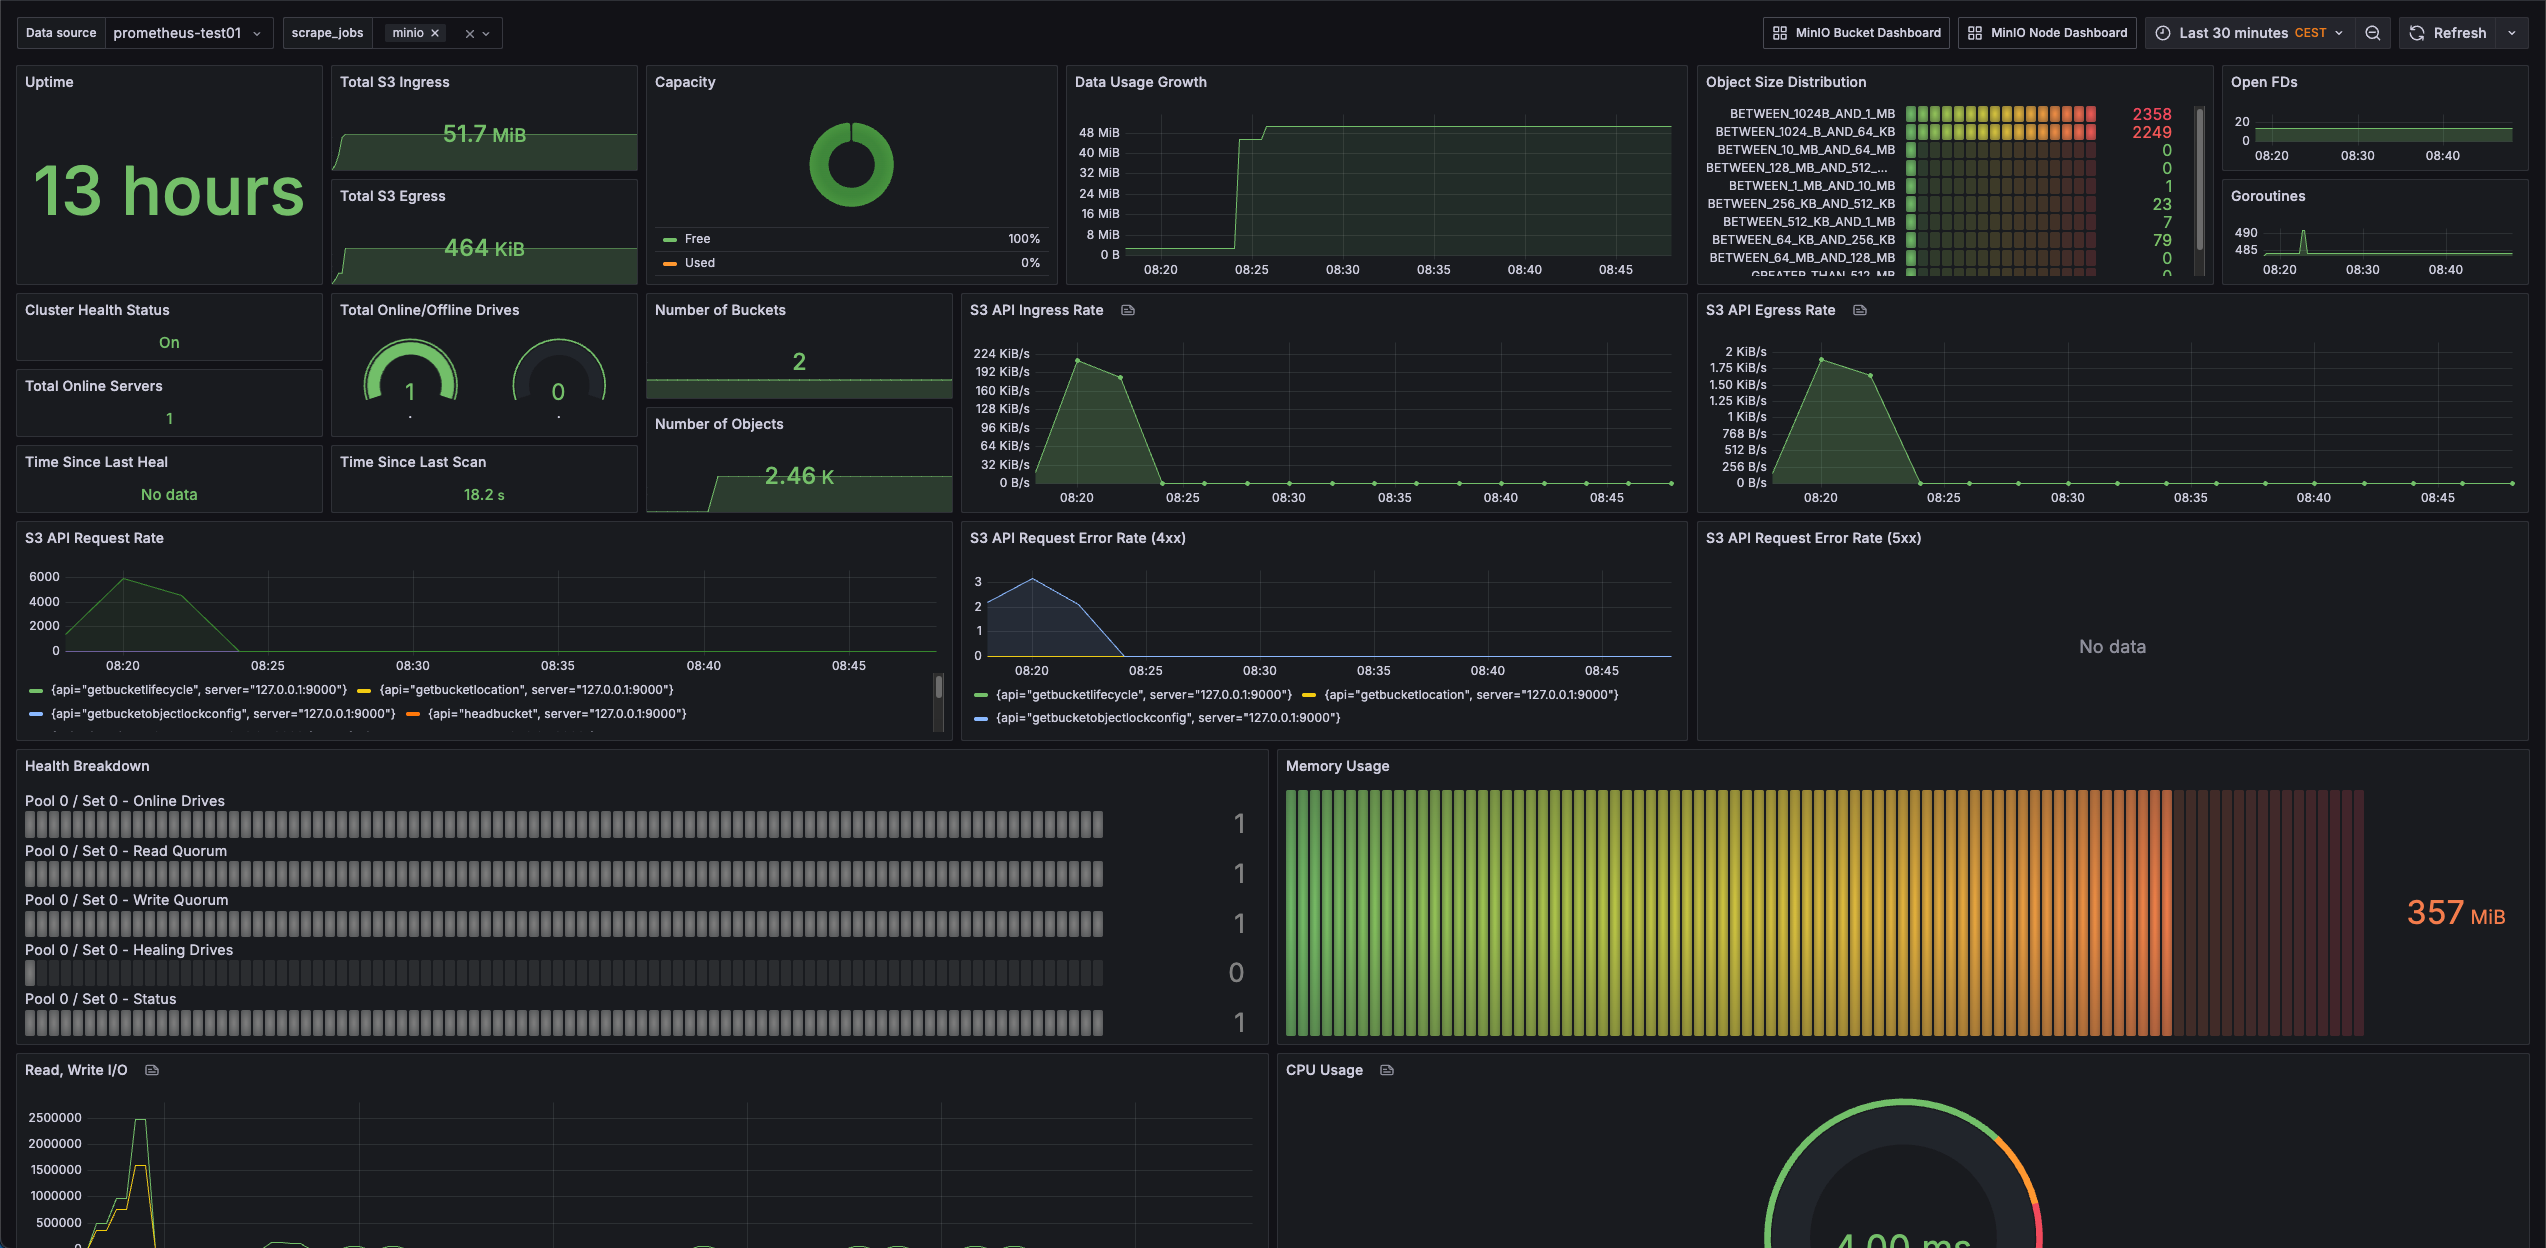
Visualize MinIO metrics with our official Grafana dashboard available on the Grafana dashboard portal.
Refer to the dashboard json file here.
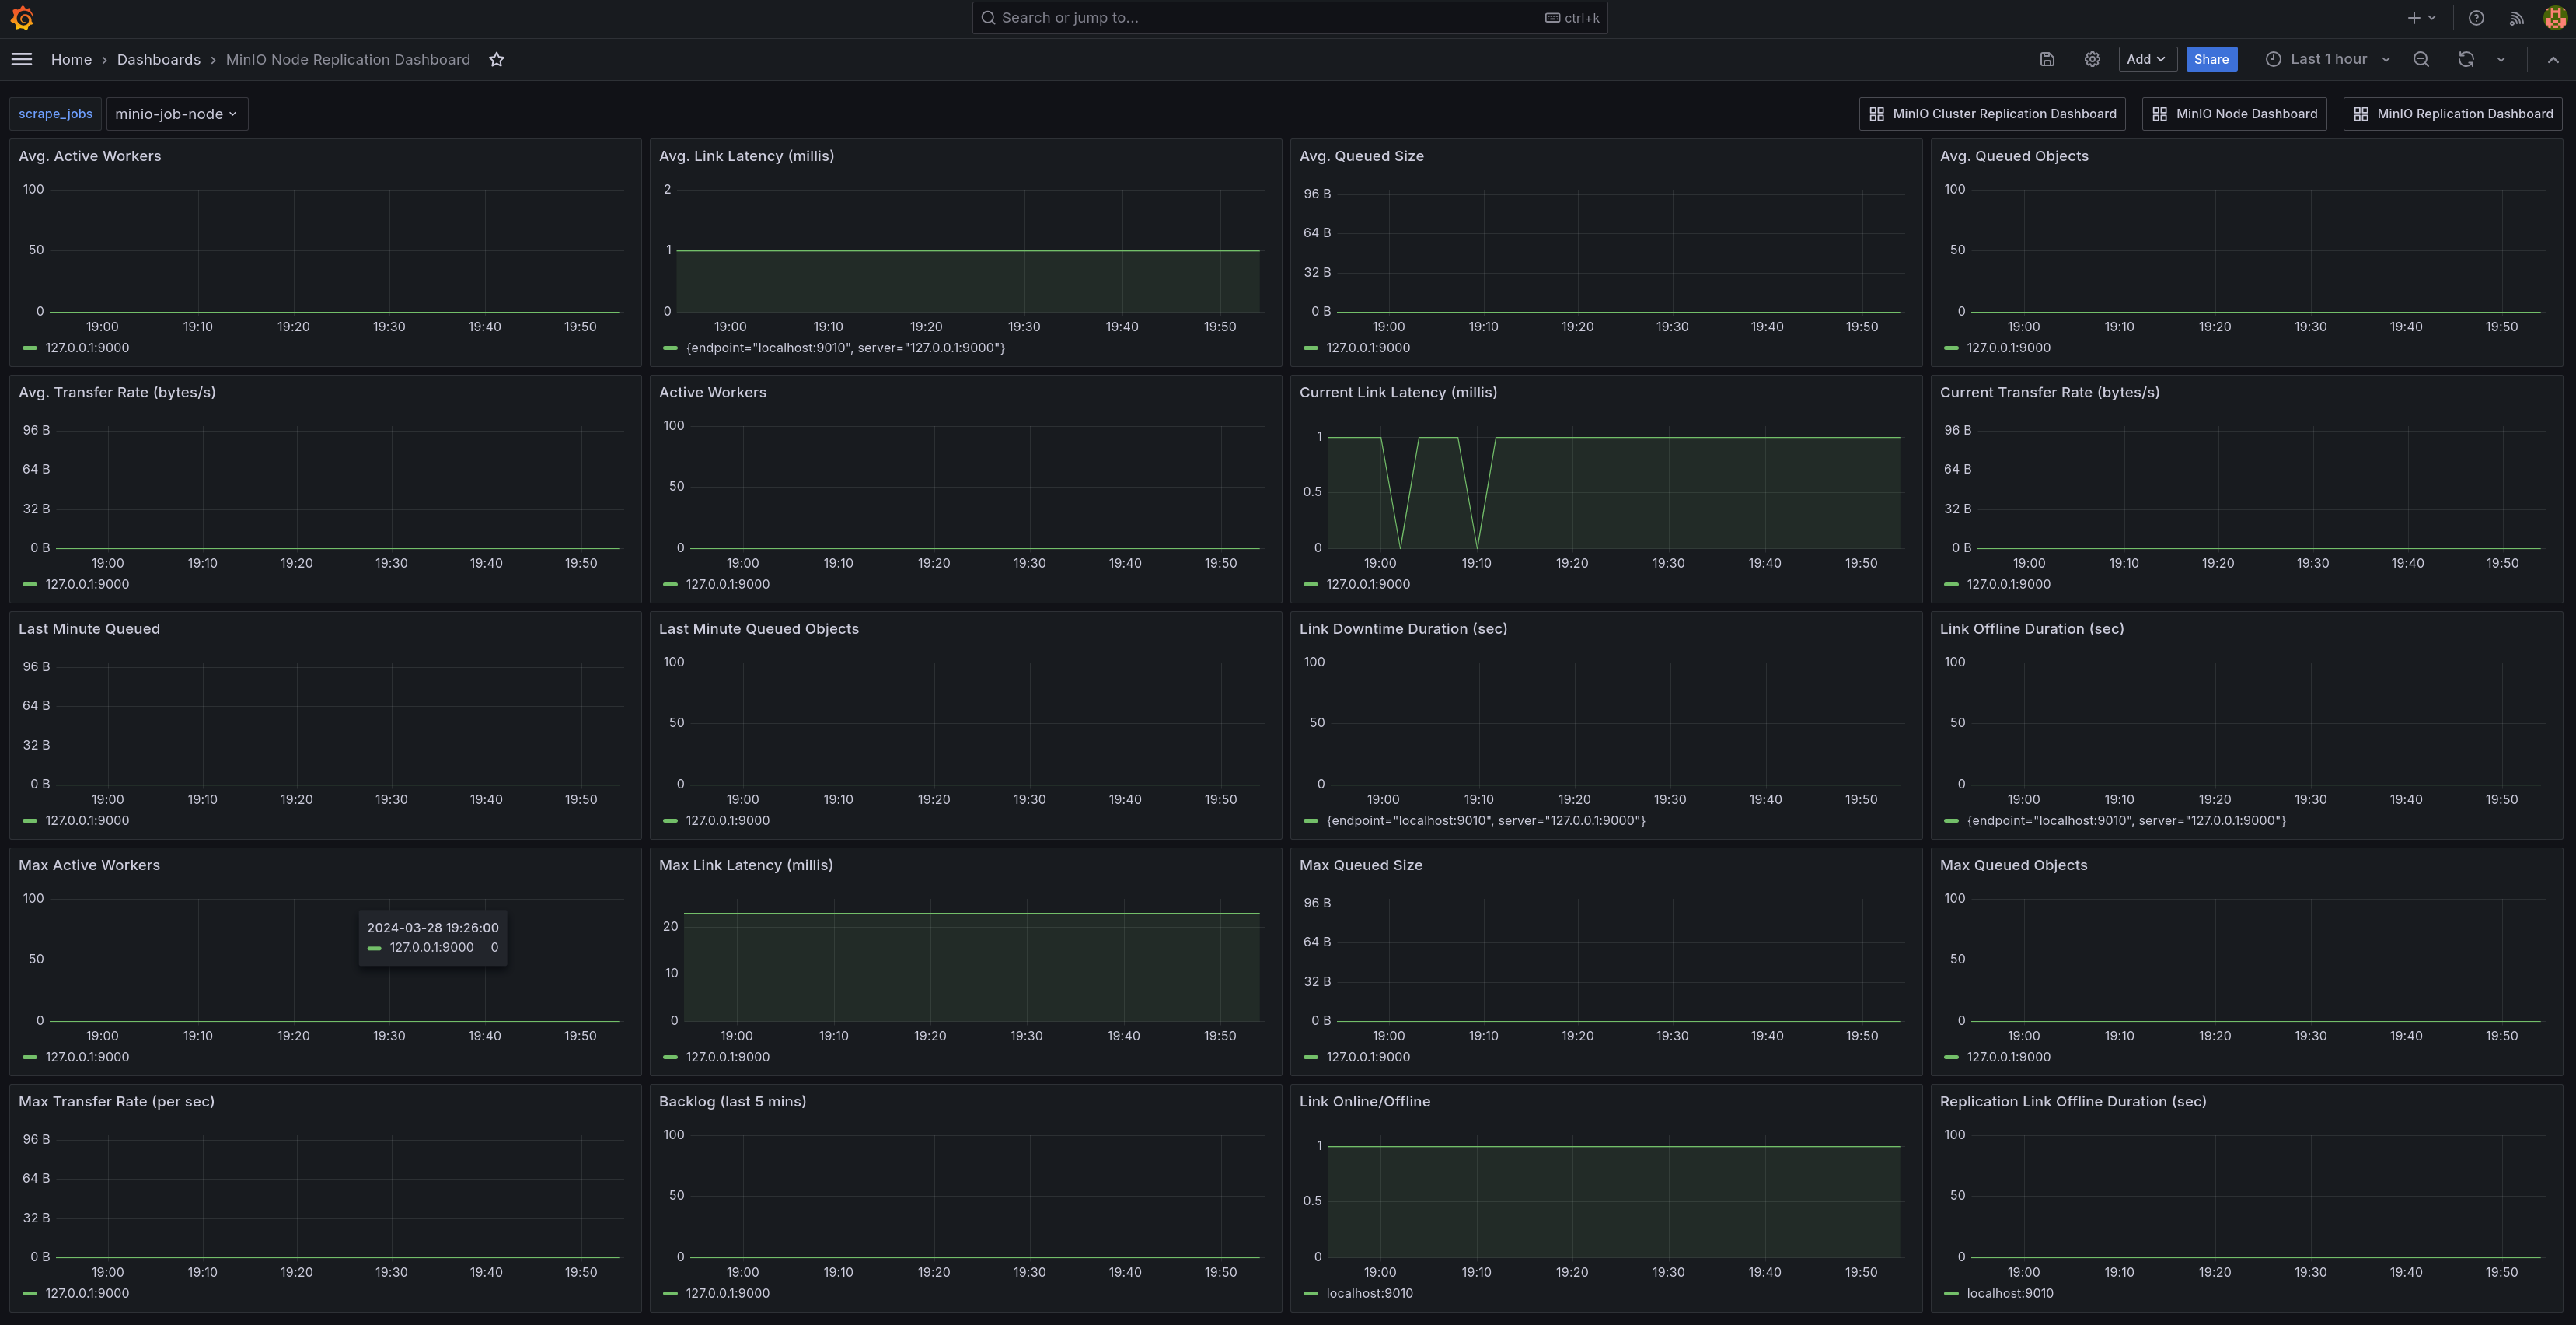
Node level Replication metrics can be viewed in the Grafana dashboard using json file here
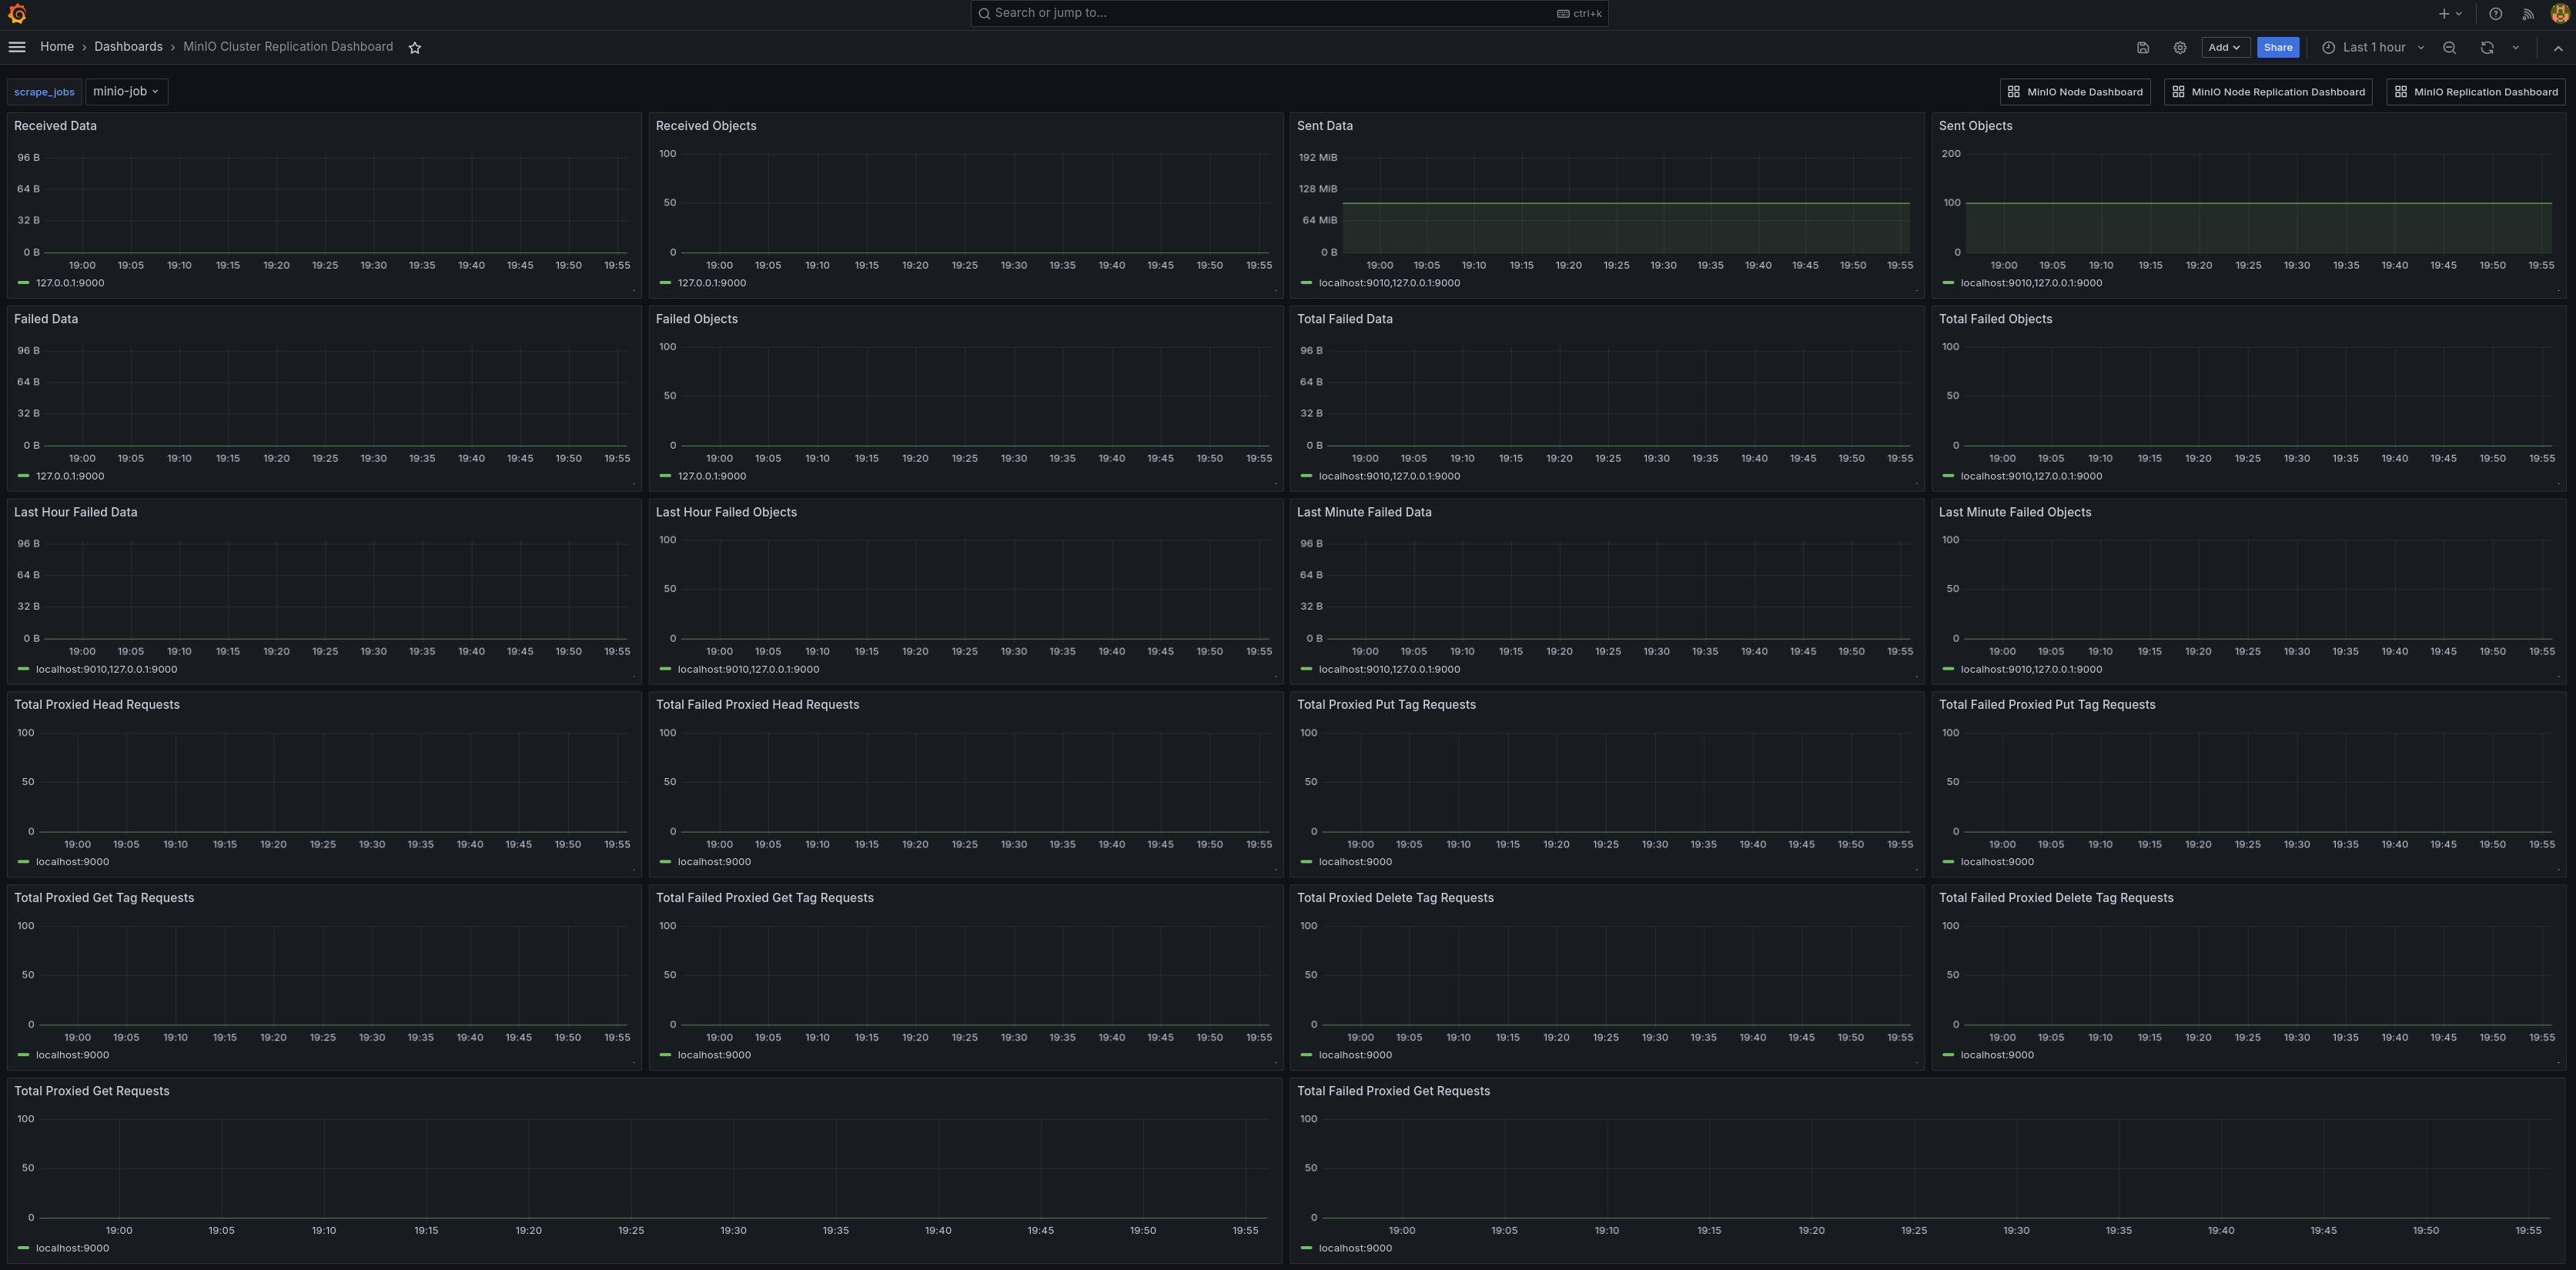
Cluster level Replication metrics can be viewed in the Grafana dashboard using json file here
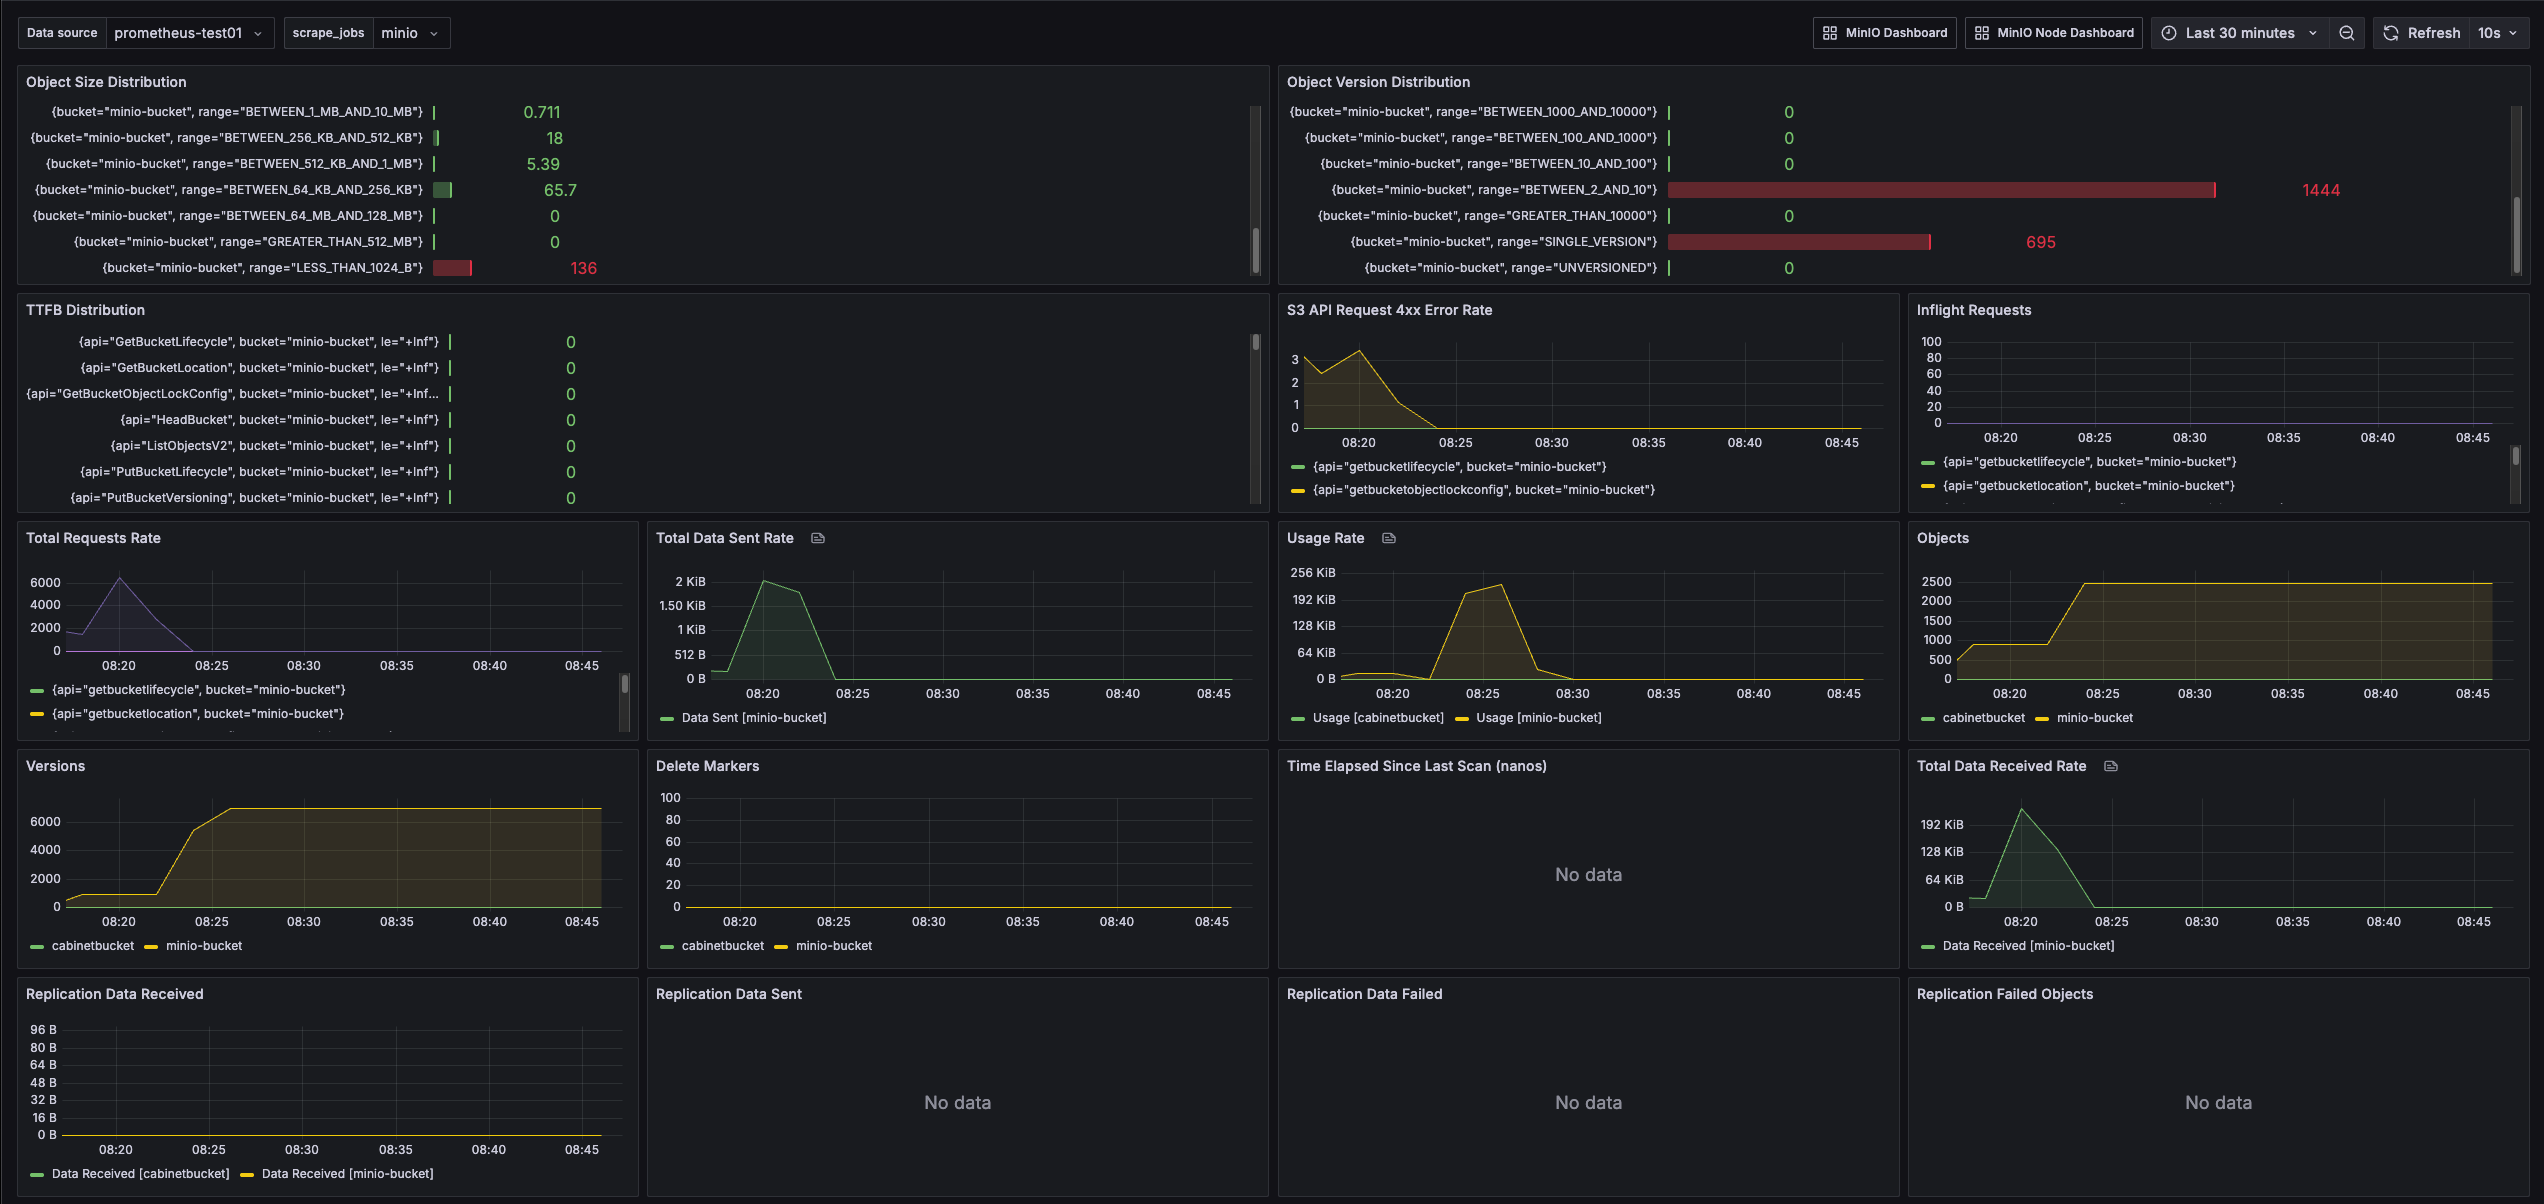
Bucket metrics can be viewed in the Grafana dashboard using json file here
Node metrics can be viewed in the Grafana dashboard using json file here
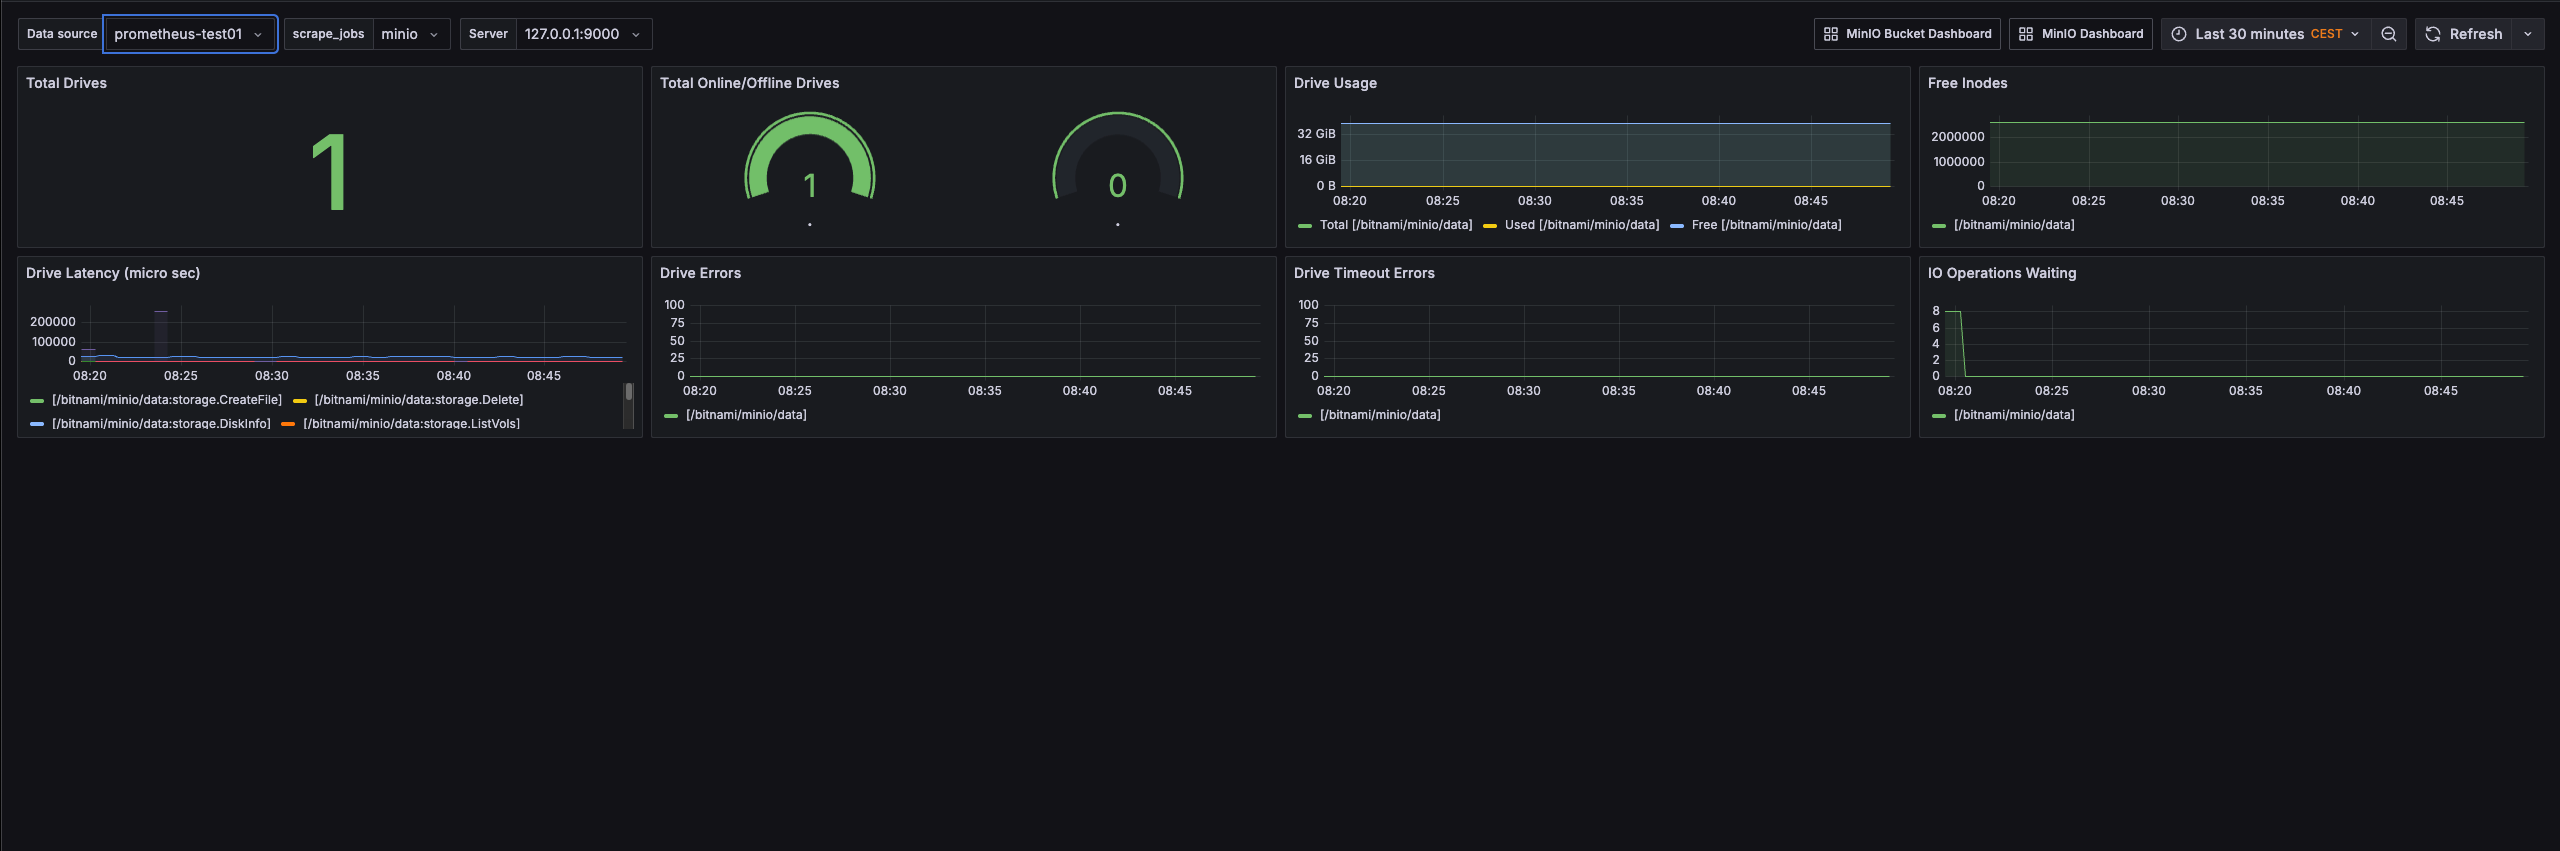
Note: All these dashboards are provided as an example and need basis they should be customized as well as new graphs should be added.