 Feng Ruohang
fd2ca1c6d2
Feng Ruohang
fd2ca1c6d2
README, README_ZH, SECURITY, COMPLIANCE, CONTRIBUTING, NOTICE,
code_of_conduct, the vulnerability and PR-etiquette documents, the GitHub issue
and pull request templates, and the docs/ tree all present Silo as the product.
The Grafana dashboards under docs/metrics/prometheus/grafana/ have their panel
titles and descriptions rebranded while every minio_* query, label and
expression is left alone, so existing alerts and recording rules keep matching.

The distinction the review demanded is applied per hit rather than by
search-and-replace:

- Product and command text becomes Silo and silo: install and run instructions,
  systemd examples, compose services, download links, badges.
- Protocol and interface text keeps MinIO: MINIO_* variables, minio_* metrics,
  x-minio-* headers, /minio/* routes, .minio.sys, arn:minio, and API field and
  error names.
- Attribution keeps MinIO and gains the fork's own: the AGPL obligations,
  original copyright, CREDITS and NOTICE stay, with the modification notice
  added alongside rather than replacing them.
- Historical and third-party references are left as facts, not rewritten for
  brand tidiness.

README and README_ZH each carry an explicit non-affiliation notice, document
the side-by-side package migration including the
/etc/systemd/system/silo.service.d/10-legacy-user.conf drop-in for keeping a
legacy UID/GID, and state that recursive chown is never performed. The trademark
attribution uses the policy's approved "based on MinIO technology" wording, not
the shortened form the policy rejects.

github.com/pgsty/minio links are left in place and labelled transitional. The
repository has not been renamed, and rewriting them now would produce documented
URLs that 404 until the cutover; they change in the cutover commit together with
the goreleaser release target, the OCI source label and the raw-content branch.

Co-Authored-By: Claude Opus 5 (1M context) <noreply@anthropic.com>
4.4 KiB
How to configure Prometheus AlertManager
Alerting with prometheus is two step process. First we setup alerts in Prometheus server and then we need to send alerts to the AlertManager. Prometheus AlertManager is the component that manages sending, inhibition and silencing of the alerts generated from Prometheus. The AlertManager can be configured to send alerts to variety of receivers. Refer Prometheus AlertManager receivers for more details.
Follow below steps to enable and use AlertManager.
Deploy and start AlertManager
Install Prometheus AlertManager from https://prometheus.io/download/ and create configuration as below
route:
  group_by: ['alertname']
  group_wait: 30s
  group_interval: 5m
  repeat_interval: 1h
  receiver: 'web.hook'
receivers:
  - name: 'web.hook'
    webhook_configs:
      - url: 'http://127.0.0.1:8010/webhook'
inhibit_rules:
  - source_match:
      severity: 'critical'
    target_match:
      severity: 'warning'
    equal: ['alertname', 'dev', 'instance']
This sample configuration uses a webhook at http://127.0.0.1:8010/webhook to post the alerts.
Start the AlertManager and it listens on port 9093 by default. Make sure your webhook is up and listening for the alerts.
Configure Prometheus to use AlertManager
Add below section to your prometheus.yml
alerting:
  alertmanagers:
  - static_configs:
    - targets: ['localhost:9093']
rule_files:
  - rules.yml
Here rules.yml is the file which should contain the alerting rules defined.
Add rules for your deployment
Below is a sample alerting rules configuration for Silo. Refer https://prometheus.io/docs/prometheus/latest/configuration/alerting_rules/ for more instructions on writing alerting rules for Prometheus.
groups:
- name: example
  rules:
  - alert: MinIOClusterTolerance
    expr: minio_cluster_health_erasure_set_status < 1
    for: 5m
    labels:
      severity: critical
    annotations:
      summary: "Instance {{ $labels.server }} has lost quorum on pool {{ $labels.pool }} on set {{ $labels.set }}"
      description: "Silo instance {{ $labels.server }} of job {{ $labels.job }} has lost quorum on pool {{ $labels.pool }} on set {{ $labels.set }} for more than 5 minutes."
Verify the configuration and alerts
To verify the above sample alert follow below steps
- Start a distributed Silo instance (4 nodes setup)
- Start Prometheus server and AlertManager
- Bring down couple of Silo instances to bring down the Erasure Set tolerance to -1 and verify the same with
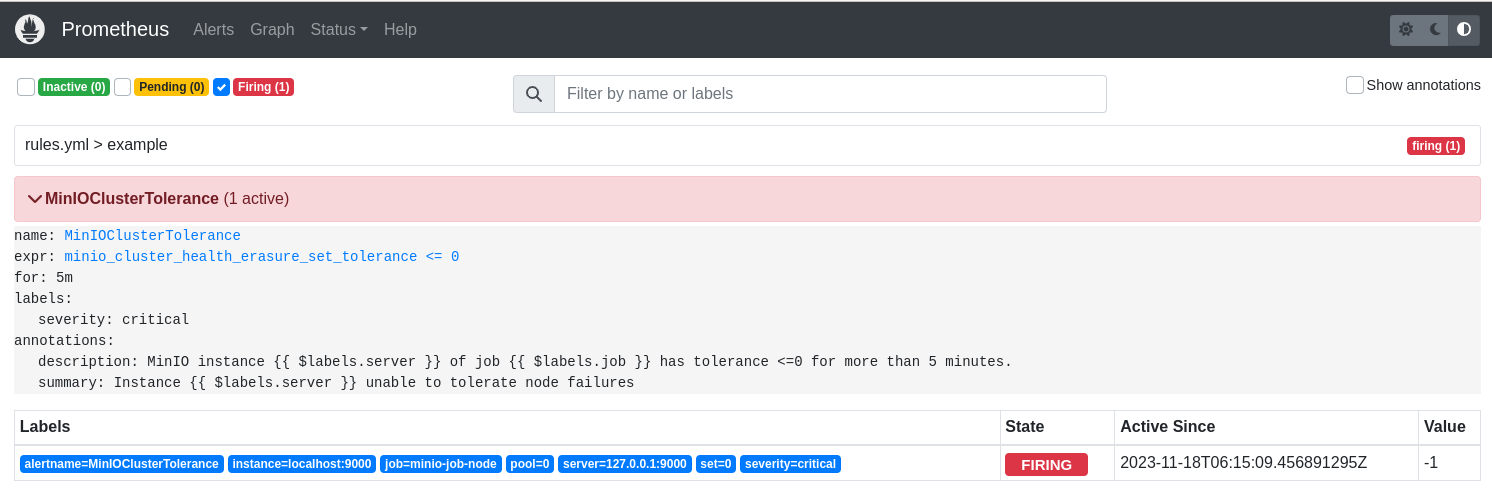
mc admin prometheus metrics ALIAS | grep minio_cluster_health_erasure_set_status - Wait for 5 mins (as alert is configured to be firing after 5 mins), and verify that you see an entry in webhook for the alert as well as in Prometheus console as shown below
{
  "receiver": "web\\.hook",
  "status": "firing",
  "alerts": [
    {
      "status": "firing",
      "labels": {
        "alertname": "MinIOClusterTolerance",
        "instance": "localhost:9000",
        "job": "minio-job-node",
        "pool": "0",
        "server": "127.0.0.1:9000",
        "set": "0",
        "severity": "critical"
      },
      "annotations": {
        "description": "Silo instance 127.0.0.1:9000 of job minio-job has tolerance <=0 for more than 5 minutes.",
        "summary": "Instance 127.0.0.1:9000 unable to tolerate node failures"
      },
      "startsAt": "2023-11-18T06:20:09.456Z",
      "endsAt": "0001-01-01T00:00:00Z",
      "generatorURL": "http://fedora-minio:9090/graph?g0.expr=minio_cluster_health_erasure_set_tolerance+%3C%3D+0&g0.tab=1",
      "fingerprint": "2255608b0da28ca3"
    }
  ],
  "groupLabels": {
    "alertname": "MinIOClusterTolerance"
  },
  "commonLabels": {
    "alertname": "MinIOClusterTolerance",
    "instance": "localhost:9000",
    "job": "minio-job-node",
    "pool": "0",
    "server": "127.0.0.1:9000",
    "set": "0",
    "severity": "critical"
  },
  "commonAnnotations": {
    "description": "Silo instance 127.0.0.1:9000 of job minio-job has lost quorum on pool 0 on set 0 for more than 5 minutes.",
    "summary": "Instance 127.0.0.1:9000 has lost quorum on pool 0 on set 0"
  },
  "externalURL": "http://fedora-minio:9093",
  "version": "4",
  "groupKey": "{}:{alertname=\"MinIOClusterTolerance\"}",
  "truncatedAlerts": 0
}